Data Analysis
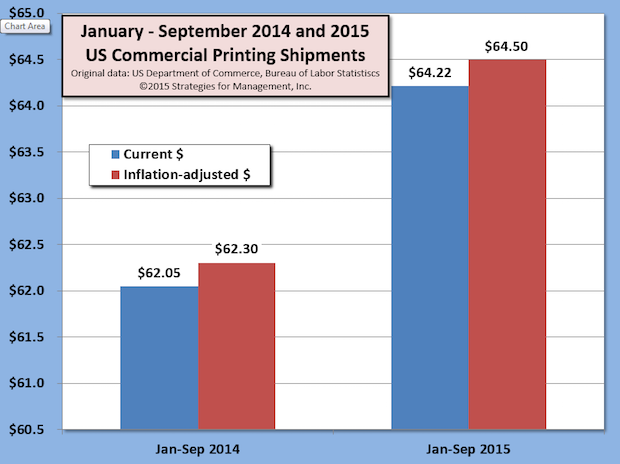
Third Quarter US Commercial Printing Shipments Have Highest Growth Rate Since 1996
Published: November 4, 2015
The US Commerce Department reported that commercial printing industry shipments are up for 16 consecutive months in current dollars compared to the same month of 2014. Full Analysis
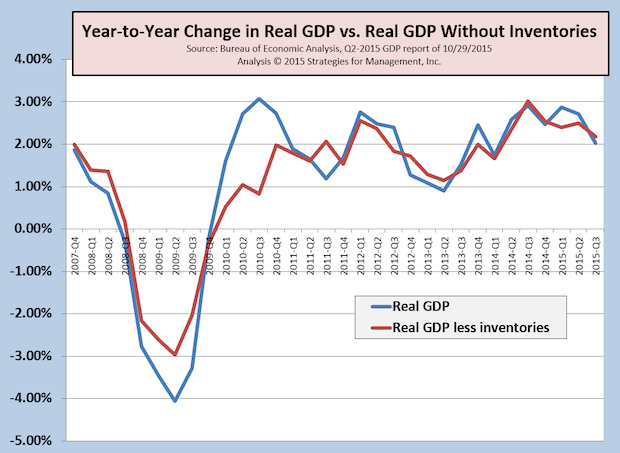
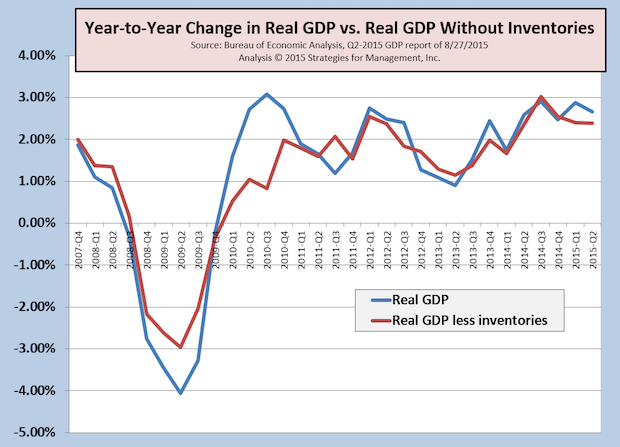
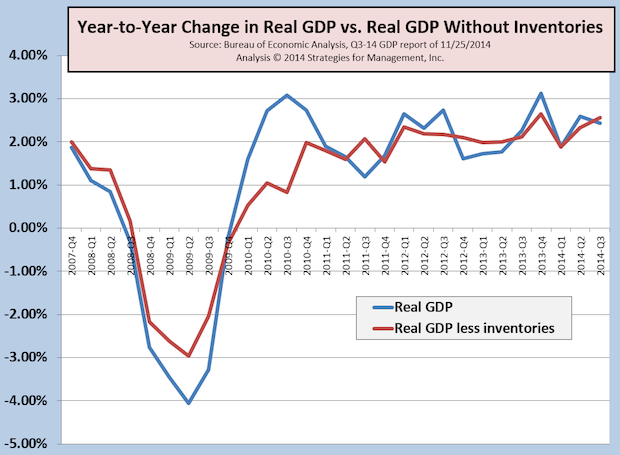
Third Quarter GDP Not Good, but Better Under the Surface
Published: October 29, 2015
The advance estimate of third quarter 2015 real GDP is +1.5%. We much prefer the year-to-year comparison, and also without the fluctuations of inventories. Those figures, also indicated in the chart, are +2.03% and +2.18% respectively. Net inventories have been running very high, but in the third quarter were $56.8 billion. This figure was cut in half from Q2, and is close to the 2010 to 2014 average. Full Analysis
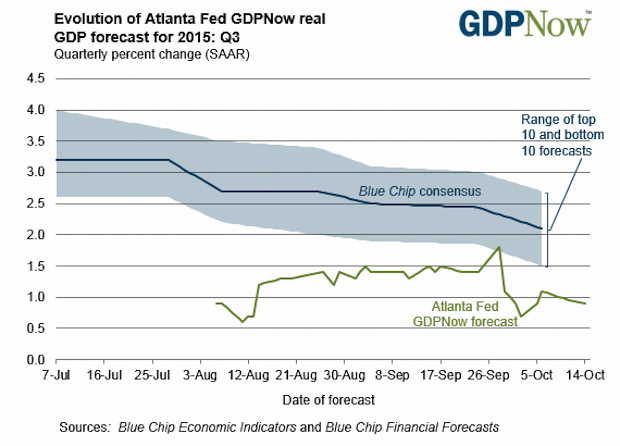
Recession Coming? Third Quarter GDP Looks Weaker than Experts Forecasted
Published: October 22, 2015
The latest estimate (October 20) by the Atlanta Fed's GDPNow model indicates that third quarter GDP will be +0.9%. That is, until the next data for their model comes in.
Full Analysis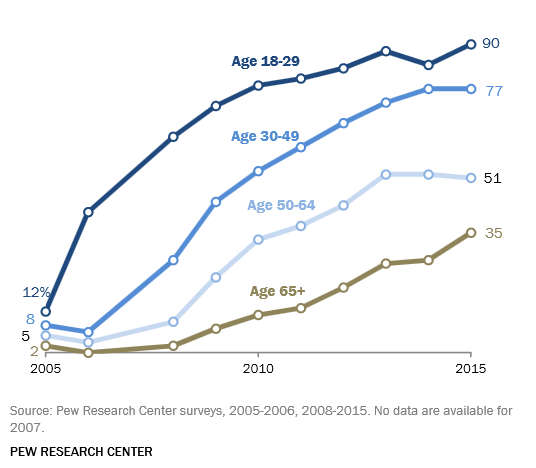
Pew Internet Survey Shows Social Media Use Up, Way Up, in Last Ten Years
Published: October 15, 2015
The Pew Internet Survey has released their latest survey (free download) of social media use and the long term trends are striking. The organization started tracking use in 2005 when social media use was by just 7% of the US population. Now, 65% of adults use social networking sites. Our chart shows the increases by age group.
Ninety percent of those between 18 and 29 use social media, which is not a surprise. Those social media users who are 65+ has more than tripled from 11% in 2010 to 35% in 2015. The report includes data about social media use by various demographics including income, race, gender, community, and education.
Full Analysis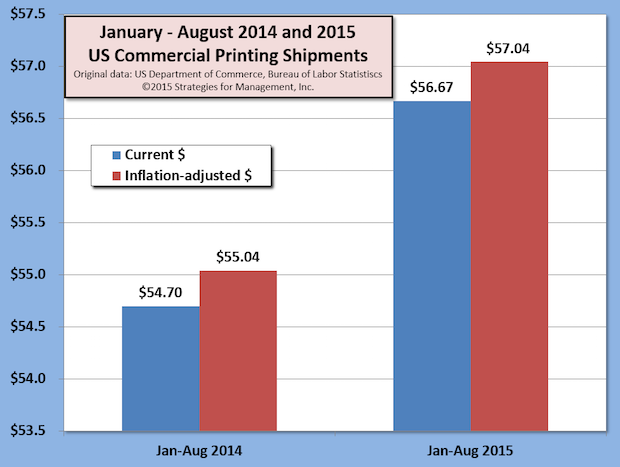
Commercial Printing Shipments in Uptrend: 15 Consecutive Months of Growth, Best Growth Rate Since 1996
Published: October 14, 2015
US commercial printing industry shipments are up for 15 consecutive months compared to the same month of the prior year. Full Analysis
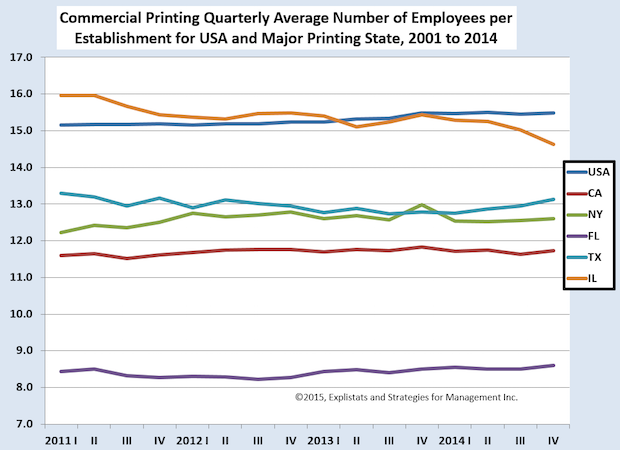
Changes in Commercial Printing Employment by State
Published: October 8, 2015
The chart shows the changes in the average number of employees per establishment in the US and large printing states. The average size of printing businesses in an area offers clues to the kinds of printing produced there and the history of the industry in that area. Full Analysis
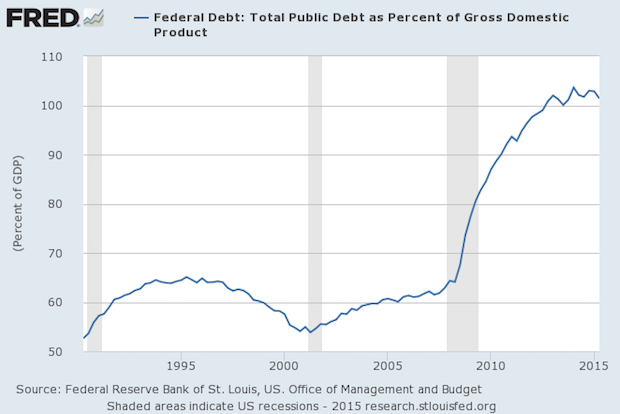
Debt as a Percentage of GDP
Published: October 2, 2015
Many people confuse debt and deficit when they see it as part of the Federal government's annual budget. Deficit is the annual shortfall between a government's spending and its revenues. Debt is the accumulation of all of the deficits and surpluses of the prior years in that government's history. Full Analysis
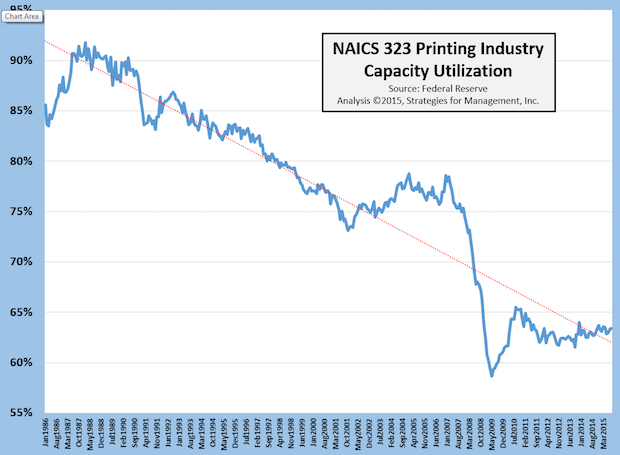
Updated Printing Industry Capacity Utilization Data – Not What Everyone Thinks It Is
Published: October 1, 2015
Even in the industry's most profitable and growing years, the mantra “there's too much capacity in the industry” was always heard. It's been a misplaced and inaccurate portrayal of the business, yet it persists. Full Analysis
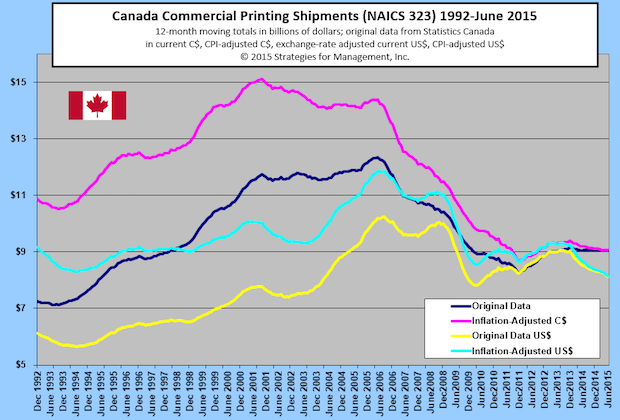
Canada's Commercial Printing Shipments
Published: September 17, 2015
Canada's commercial printing industry had a small rebound more than three years ago, before that of the US, and has been on a somewhat steady course since. In US dollars, however, Canada's gains market have been erased recently with the stronger dollar. Full Analysis
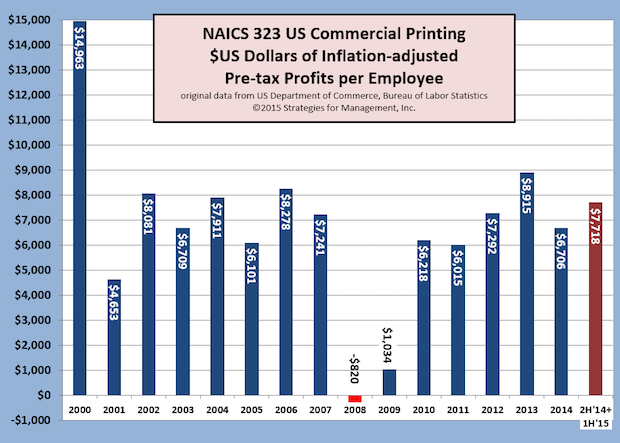
Profits Per Employee Increase
Published: September 10, 2015
The nearly $15,000 profit per employee of 2000 may not be in the cards for the US commercial printing business any time soon, but it looks like this measure is headed to its second best performance since the end of the recession. Using the latest data for the second quarter of 2015, and adding the previous three quarters to create a full year, profits per employee seem to be headed to $7,700, a thousand dollars more than the level of 2014. Full Analysis
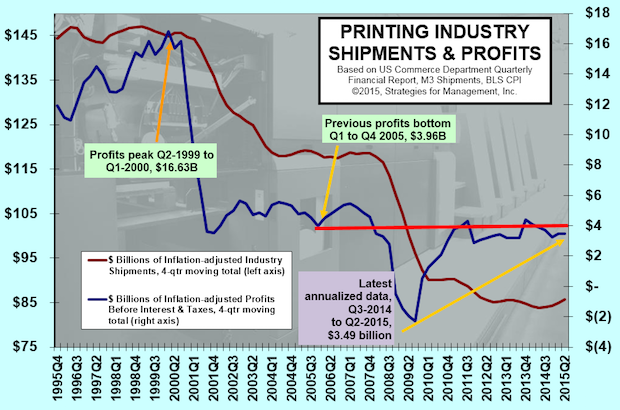
Improvement in Industry Shipments, Profits Improvement Elusive
Published: September 9, 2015
The 4-quarter moving total of inflation-adjusted US commercial printing shipments have been increasing, but unfortunately profits have not. Q2-2015 four-quarter shipments are up +2.3%, but profits are unfortunately down for the last four quarters -10.8%. Full Analysis
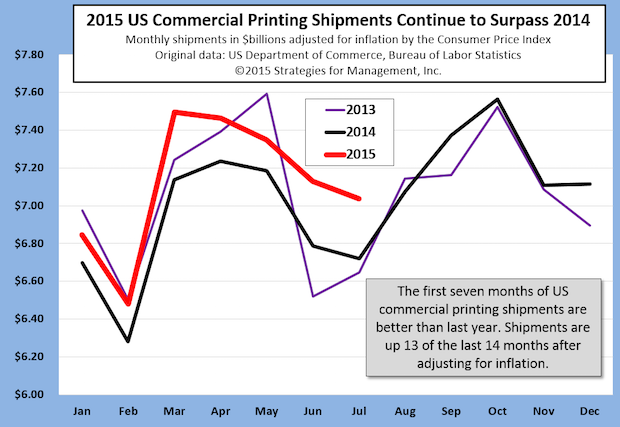
Latest Printing Shipments Reflect Rebound
Published: September 3, 2015
July's inflation-adjusted US commercial printing shipments continued to outshine prior year shipment levels. This was the best July since 2008 on a current dollar basis and since 2010 on an inflation-adjusted basis. On average, monthly industry shipments have been about $200 million higher than the year before. They are also tracking closer to GDP growth rates, a feat the industry has not done for almost two decades. Full Analysis
Recovery Indicators Mixed with Slight Downward Bias; Sluggish Economy Remains
Published: September 2, 2015
Four of the six recovery indicators fell last month, but the non-manufacturing new orders indicator remained very strong. World markets had a rocky month, and the NASDAQ fell -7% since the last indicators. Full Analysis
US Commercial Printing Shipments Up for 14 Consecutive Months
Published: September 2, 2015
US commercial printing shipments were nearly $7.04 billion in July, a $392 million increase (+4.9%) on a current dollar basis compared to 2014. This was the strongest July since 2008. Full Analysis
Q2 GDP Revised Up, Bigger Rebound from Q1... But What's Ahead?
Published: August 27, 2015
The first report of Q2-2015 real GDP was +2.3%, and now it's been raised to +3.7%, well ahead of forecaster expectations. On a longer-term year-to-year basis, the growth rate is +2.5%, still almost a full percentage point below post-WW2 average.
Longer term rate +2.5%. The effects of inventory increases is still a major factor in the growth, but there were other positives in the report implying that Q2 was broadly better than originally thought. There are concerns among professional forecasters that the inventory buildup will result in slower growth as those stockpiles are reduced. Considering that two thirds of the third quarter is almost complete, we know that international trade is being disrupted by currency and solvency issues in China and other countries. The Federal Reserve Bank of Atlanta GDPNow estimates that third quarter GDP will be at +1.4%. Please also note a recent chart where we showed important key indicators that have yet to surpass their recession levels from Q4-2007.
Full Analysis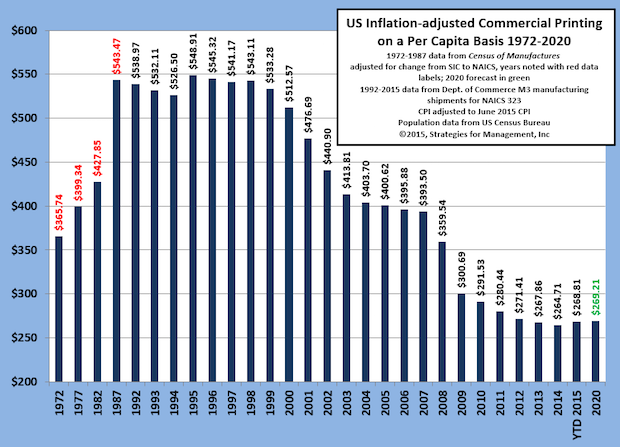
Per Capita Commercial Printing Shipments Stabilize; Forecast Models Project Levels to Continue
Published: August 20, 2015
The per capita value of US commercial printing shipments has stabilized at nearly $270, and the recent change in the direction of shipments in the last year or so has changed the forecasts. Forecast models place heavy weight on recent history, and that fact has changed the forecast for 2020 to remain at current levels. It was not long ago that the models forecast 2020 consumption at near zero, an unlikely outcome, but one worth pondering. Will shipments stay at these levels? That's unlikely, too, as media formats and loyalties are still changing.
Full Analysis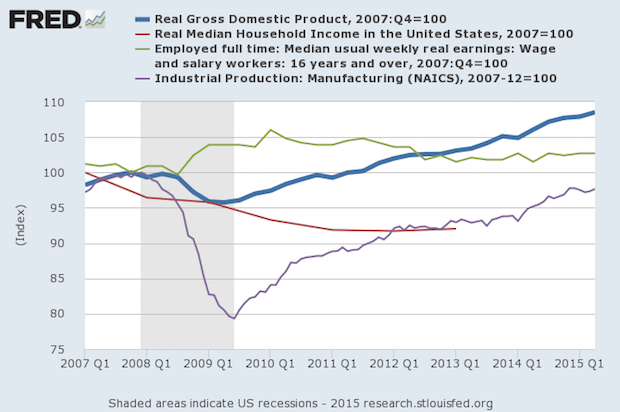
Key Indicators that Have Not Improved Since the Recession and Recovery
Published: August 14, 2015
There are numerous data series that explain that the economy has never recovered from the recession. These are not obscure data series, but mainstream ones. Gross Domestic Product should be the standard for determining the status of an economy (thick blue line). Movements in GDP should be confirmed by other measures. This week's chart uses the start of the recession, December 2007, as the base, which is 100. Full Analysis
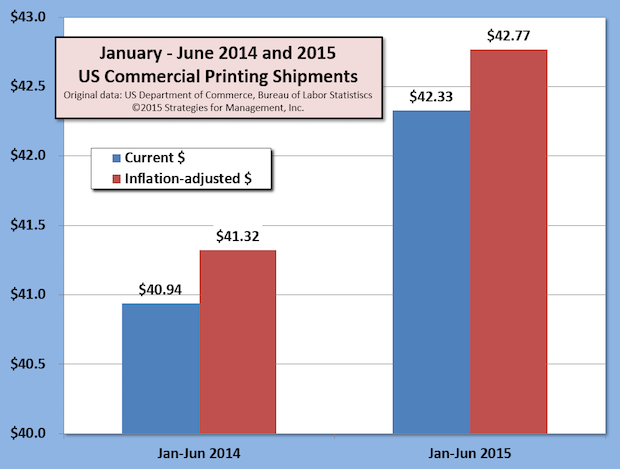
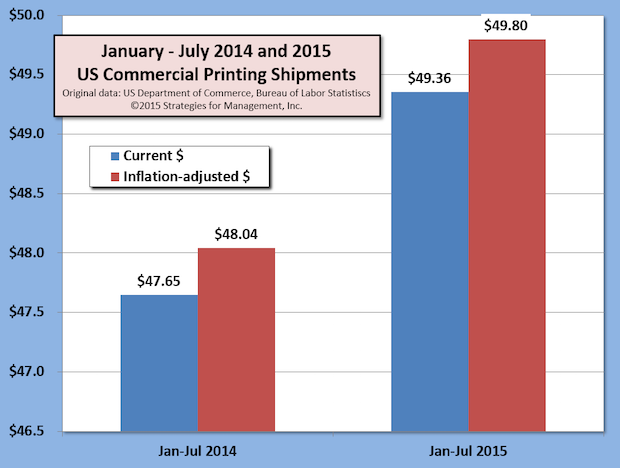
US Commercial Printing Shipments +3.5% for First Half of 2015, Exceeding Real GDP Growth
Published: August 6, 2015
US commercial printing shipments are up about +3.5% for January to June compared to the same period in 2014. The industry has been restructuring, as employment continues to decline. Usually employment and shipment levels move together in a tight range if not almost in lockstep. Full Analysis
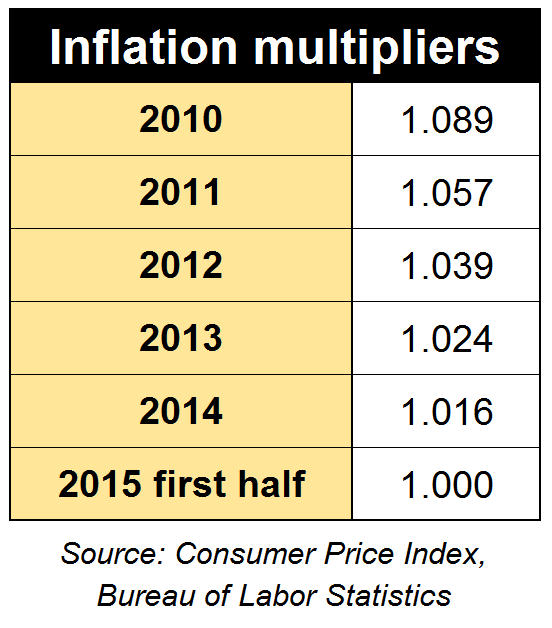
Inflation Multipliers Updated
Published: July 30, 2015
Inflation is supposedly tame, but if you're making comparisons of current year financial data to prior years, you still need to adjust for the years when inflation was not. The chart was created from Consumer Price Index data for each of the years specified. When looking at your company history, multiply your data for each year by the multiplier specified. This will give you an approximation for the effects of inflation on your business, and make your historical analysis, especially in the process of budgeting, to be more realistic. Adjusting your data, even in periods of claimed low inflation, creates a sense of more urgent action. Inflation means that to stay at the same level you actually need more dollars. Staying the same is actually a cut. Full Analysis
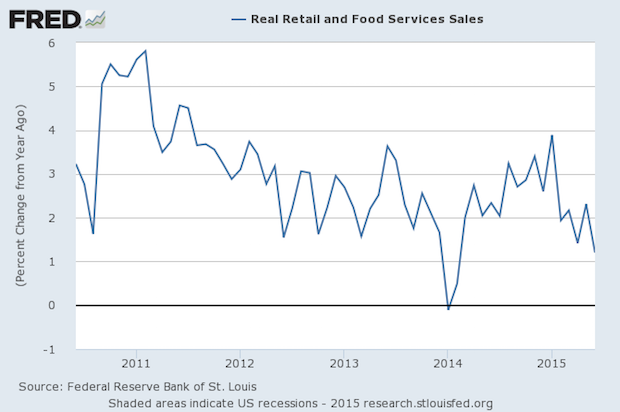
Year-to-Year Real Retail Sales Peaked in January, and Are Weaker Since
Published: July 23, 2015
June retail sales adjusted for inflation fell -0.6% compared to May. Month-to-month changes are somewhat volatile, so it's better to look at the comparisons to the prior year. The chart shows that June retail sales were +1.2% compared to last year, the worst comparison since March 2014. There are signs that the economy is slowing again. In the first quarter, real retail sales were +2.6% compared to the prior year, but this second quarter is only +1.6%. The economy always has conflicting positive and negative data, but this downturn in a key sector of the economy is likely to raise some eyebrows among economists and policymakers. Full Analysis
Is Small Business Slowing Down Again?
Published: July 22, 2015
The NFIB Small Business Index was released this week, “The weakness was substantial across the board, showing no signs of a growth spurt in the near future,” according to Bill Dunkelberg, NFIB Chief Economist. “Declines in spending plans accounted for 30 percent of the Index decline, and weaker expectations for real sales and business conditions another 20 percent. The deterioration in earnings trends accounted for about a quarter of the decline.” Full Analysis
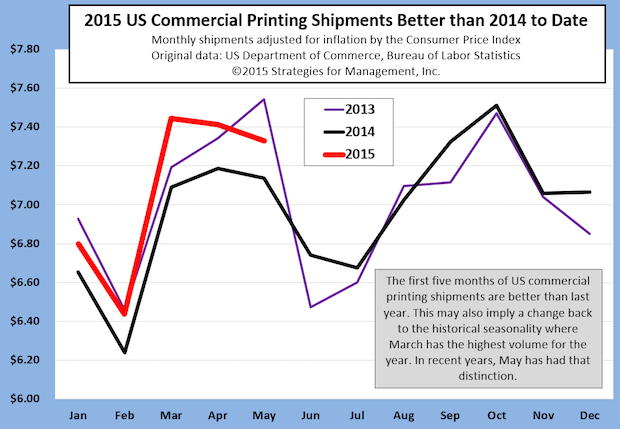
Inflation-adjusted US Commercial Printing Shipments Better than 2014
Published: July 10, 2015
Commercial printing shipments have been much higher than they are in today's market, but the bounce off the lows of 2014 this year have been notable. The comparisons toward the end of 2015 will be harder to top since the industry started to show this bounceback at the end of 2014. The transformation of commercial printing businesses has been an arduous one, with volume declines of many mainstream products, but a rise in specialty applications. Those new applications are often based in digital printing, such as wide format specialties. There's also a new generation of print business managers who are not burdened by the myopia of history, where print was paramount. These executives and owners have grown up with computers and gadgets and have a better sense of print's new role in media communications Full Analysis
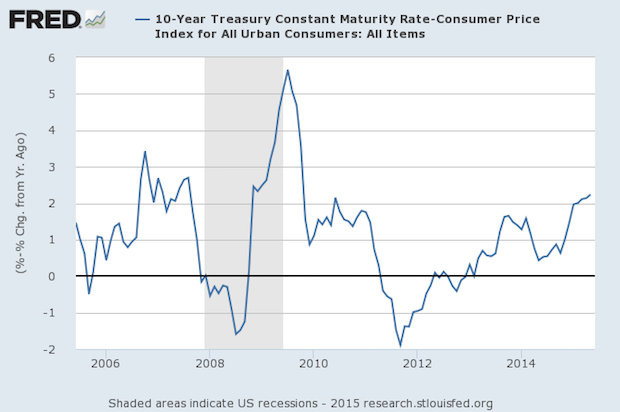
Interest Rates Have Rising Since the End of 2011
Published: June 25, 2015
We all know how the markets seem to panic when the Fed hints that rates will be rising soon, but they already have. That is, the markets have been pushing up the inflation-adjusted 10-year US Treasury since September 2011 by 420 basis points (4.2 percentage points). The rate is now the highest since June 2010, at 2.33%. This measure can be volatile because of the inflation adjustment. We used the year-to-year inflation rate as measured by the Consumer Price Index for that reason. There are Fed governors who believe that they have great latitude to be patient with a rise in inflation since their target of +2% annual inflation has not been met. This means that they believe they have a cushion of “banked” uncreated inflation that they can use up before they move aggressively. Whatever the case, a 25 basis point rise in short term rates is not much, as they might actually be catching up to the marketplace that has already moved and the Fed is already lagging well behind it. They miss an important point. The CPI does not measure inflation in a practical way. If wages are stagnant (though a little better lately), a “mild” 2% rise can be a burden. Median household income is still 4% lower than its peak just after the recession started. A 2% rise in inflation plus the 4% lower income is a 6% difference. That's something that's rarely mentioned in the business press. Full Analysis
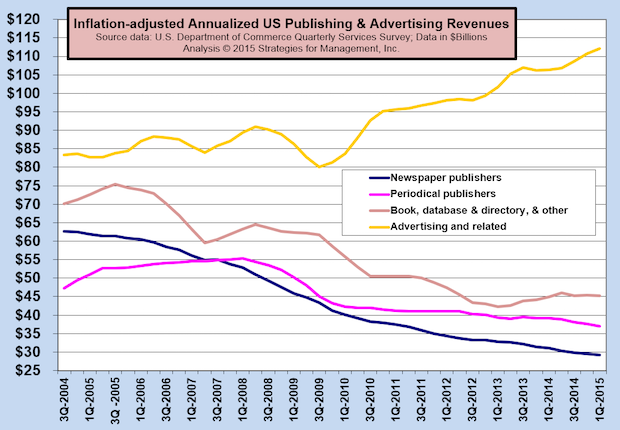
Ad Agency Revenues Still on the Rise, Up 40% Since Start of Recovery
Published: June 18, 2015
Since the start of the recovery all the way back in mid-2009, advertising agency revenues have increased by +$32 billion, +40% since that time. There are many economic indicators that have never recovered (such as full time jobs) but ad agency revenues have blown through the pre-recession high of $91 billion and is now running at the rate of $112 billion annually. The agencies have had this performance because they are immersed in the media upheaval, riding and stoking the changes in communications formats on behalf of their clients. Wages have followed this shift in media, and has been documented by us before. The average public relations pay is about $10,000 more than the averaged of all agency wages. Book publishing industry revenues have stabilized, and trends of newspaper and periodical publishing revenues are still down, but at a lesser rate. Full Analysis
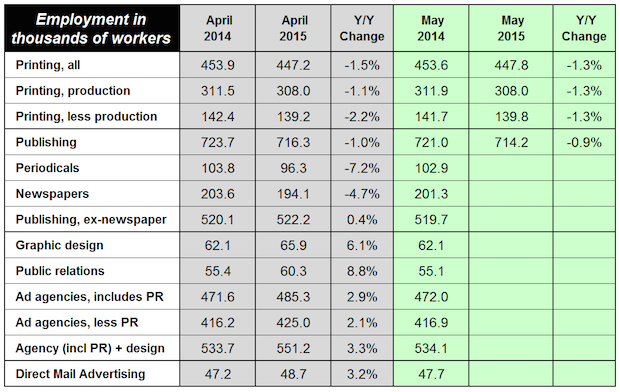
Latest Employment Data in Printing and Content Creation Markets
Published: June 11, 2015
In spite of recent strength in US commercial printing industry shipments, employment is still on a downward path. The industry seems to becoming more efficient, somewhat from better management, and somewhat from consolidation as weak establishments are aborbed or exit the market. Compared to April, however, the Bureau of Labor statistics estimates that employment increased by about 600, which is common compared for May in recent years. The April public relations employment was very strong compared to the prior year and is up +8.8%. When PR employment is excluded from ad agency employment, the number of employees in agencies is still up +2.1%. The employment data have always reflected the changes in the media market as well as the strength in the economy. Though the economy is slow, advertising agencies have reinvented themselves and are very active in social media and digital media production. Full Analysis
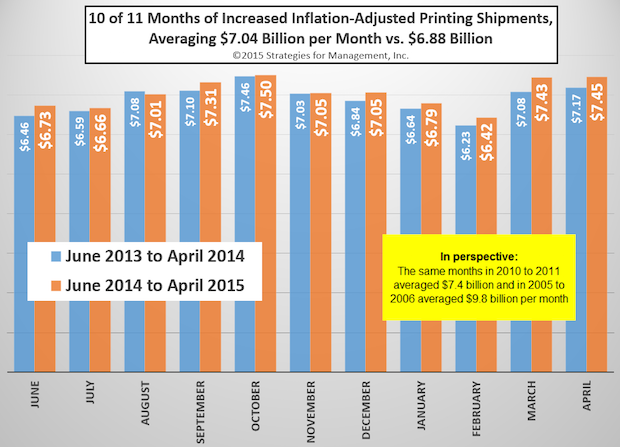
10 of 11 Months of Increased Inflation-Adjusted US Commercial Printing Shipments
Published: June 4, 2015
This chart shows how the US commercial printing shipments have been better compared to the prior year for the last 11 months of reporting by the Commerce Department. What's it mean? We're still averaging $400 million per month less than a similar period in 2010-2011, and we're well below the levels of ten years ago by about -$2.8 billion per month. The recent stability may be the result of several factors. First, weak companies are gone as a result of closures and consoPrinting Shipments Rising, Best April Since 2010lidations, leaving companies that know what modern print users need. Second, there has been a generational change in management to owners and executives who are more comfortable with digital technology because they have always used it, growing up with cell phones, video games, and computers everywhere. Third, the big targets for displacement by digital media have been pulverized, and what remains are specialties and applications more appropriate to a multichannel integrated media marketplace. Fourth, there a more companies using business development techniques (tell us about your target audience and how we can make your digital initiatives more effective) rather than old sales techniques (would you like to see my equipment list?). Then again, it could be the calm before another storm. New data networks are on their way, such as 5G, where two hour movies can be downloaded in six seconds rather than six minutes. Print has a good story to tell, but please, don't make it an old story. Print needs to be fresh and new. The market may be stable now, so use this time well to get ready for the market ahead. Full Analysis
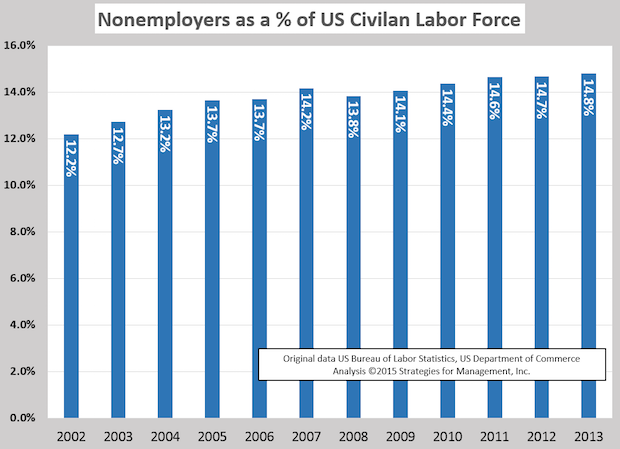
Microbusinesses Increasing as a Percentage of the Workforce
Published: May 28, 2015
The Commerce Department released its “Nonemployer Statistics” data for 2013, showing that these businesses increased to 23 million since 2012, and by 30%, three times the rate of population growth, since 2002. Let's call them “microbusinesses.” They are now more than one in seven of the workforce. Full Analysis
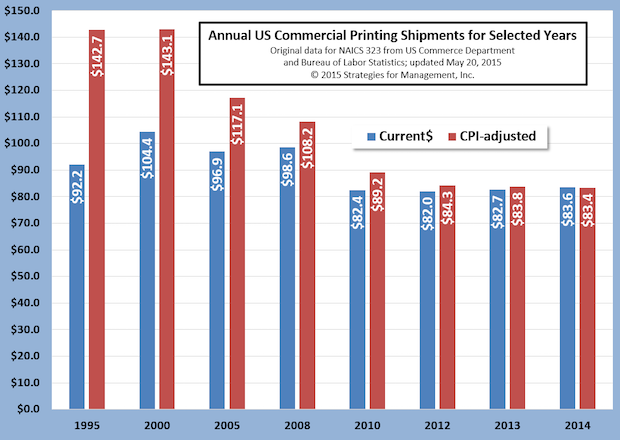
Revised Annual US Commercial Printing Shipments Show Stability in Recent Years
Published: May 21, 2015
Last week, the US Department of Commerce released its annual revisions to manufacturing shipments. Printing shipments estimates were increased a total of approximately $10 billion combined for 2013 and 2014. The data softened the decline in 2013 shipments by a considerable margin and also reaffirmed the recent rise in printing shipments over the last ten months. While shipments in 2014 were still below 2013 on an inflation-adjusted basis, the pattern of the last few years shows a decline in shipments that is more muted than the Commerce Department originally reported. Our advice is the same: this is breathing room that can be used for restructuring of print businesses with forward-looking strategies that can take advantage of the next waves of communications technologies, while implementing sales and marketing processes that are appropriate for the times ahead. Full Analysis
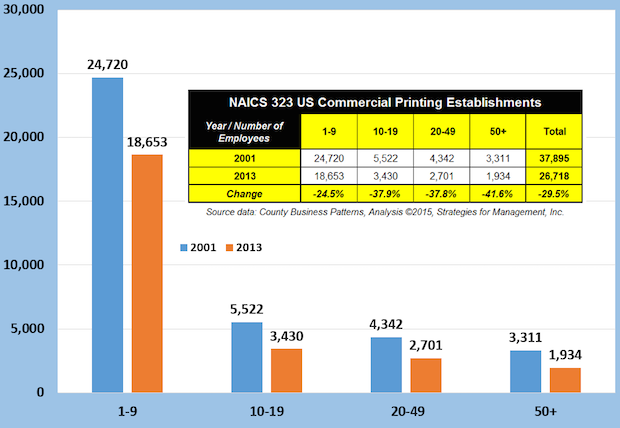
NAICS 323 US Commercial Printing Establishments
Published: May 14, 2015
These data about US commercial printing establishments are from the newly released 2013 County Business Patterns published by the Bureau of Labor Statistics. At the turn of this century, there were nearly 38,000 establishments engaged in commercial printing and services; in 2013 there were nearly 27,000. These data do not include inplant printing departments or packaging, but do include label printers and trade services. An establishment is a separate location in a practical definition, and a firm can own more than one establishment. The number of establishments is in response to the size, scope, and nature of overall print demand, but there are other factors.
Full Analysis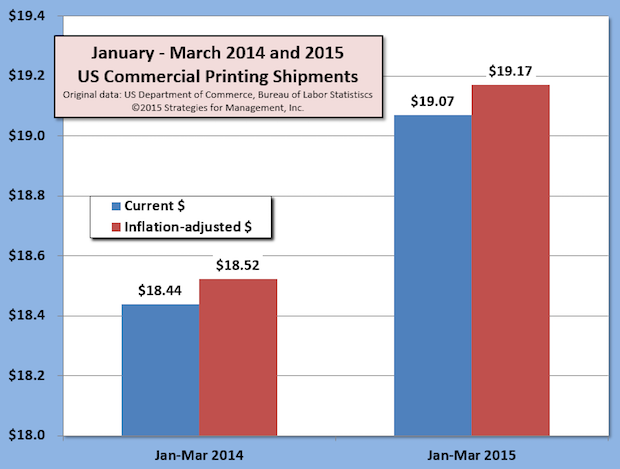
First Quarter US Commercial Printing Shipments Up +3.5% Versus 2014
Published: May 8, 2015
The last ten months of US commercial printing shipments have increased +3% compared to the same months of the prior years. For the first calendar quarter, shipments are up +3.5% compared to the same quarter of 2014. There has not been this kind of growth for about ten years. Please note, however, that the Commerce Department is revising at least three years of historical data next week; it's not possible to determine how the data will change. Assuming the pattern of these data remain the same, it's not a long term bottoming of the shipment level that will turn upward again. The march of digital technologies that offer alternatives to print will continue (read what 5G networks will bring in 2020, for example). It's more likely a pause that should be used to reposition well-running print businesses for the future, consider investing in capabilities and businesses that will take advantage of the new communications innovations ahead, and develop alliances with others whose talents will be needed to do so. This might be 2005-2007 playing out again for us. If your business is growing, don't rest on your laurels. Appreciate the flexibility your business has to prepare for the future and use the time wisely. Never hunker down and wait for things to play out. Full Analysis
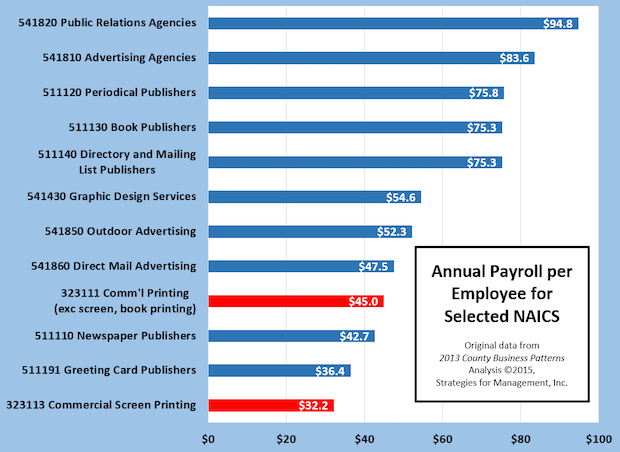
Payroll per Employee for Commercial Printing and Content Creation Businesses
Published: April 30, 2015
The 2013 County Business Patterns report was just released by the Bureau of Labor Statistics, one of the most valuable of all government economic reports. The data are based on Social Security tax filings made by employers. In this manner, the BLS can count the number of business establishments and the number of employees of those establishments with great accuracy from analysis from the mandatory filings of Form 941, submitted with company payroll taxes. As the data show, content creation businesses have much higher per employee annual salaries. This makes these industries very attractive to new employees, especially those starting their careers. The most interesting to me is the rise in public relations agencies. In the late 1980s, the payroll for ad agency workers was about one-third more than public relations. In 2005, they were about the same. In these 2013 data, PR employees are paid about one-eighth more. Full Analysis
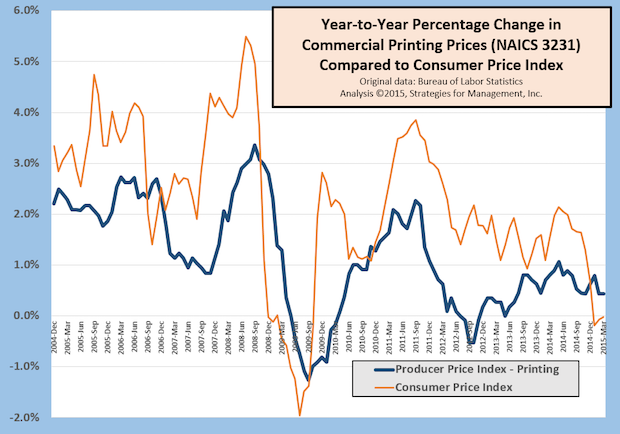
Printing Prices Compared to General Inflation
Published: April 23, 2015
The Bureau of Labor Statistics publishes many indexes of inflation, the best known of which is the Consumer Price Index. The BLS also publishes hundreds of other indexes in the Producer Price Index (PPI) series that track price changes in industries, products, and commodities. This week's chart shows the year-to-year change in CPI (orange line) and the PPI for printing (blue line) on a monthly basis for a little more than ten years. For most of that period, printing prices have lagged consumer prices, often by wide margins. Since December 2004, printing prices are up +14% while consumer prices are up +27%. That is, printing prices are increasing at about half the rate of consumer prices. Or, looked at differently, printing prices are about -10% less than the change in consumer prices: print is getting cheaper every day. But print owners and their workers cannot spend printing dollars when they go to the supermarket; they have to make up for the 10% shortfall in prices somehow. This is difficult since many of the prices printers need to pay for wages and materials more closely follow consumer prices. It's a double-edged problem: lower revenues, higher costs. Profit leaders have figured out how to survive in this environment as they still stand out from their peers. But these double-edged pressures have caused weak companies to leave or offer themselves as consolidation candidates. Full Analysis
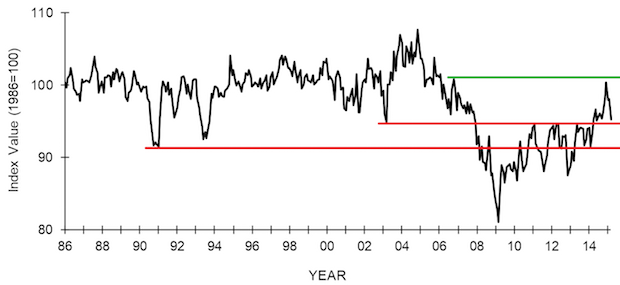
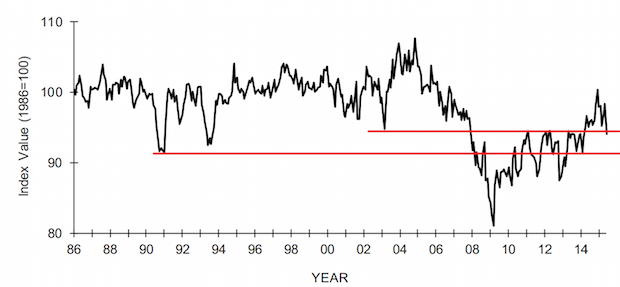
NFIB Small Business Index Falls
Published: April 16, 2015
The monthly NFIB Small Business Index took a step back after it nearly reached the pre-recession high. The chart shows that high of a few years ago as a green line. The index fell almost to the bottom of the 2003 recession level. For a few years the Index seemed range-bound between that recession and the lows of the recession of the early 1990s (the two red lines). This particular survey had all ten elements of its index fall, which is highly unusual. The Index bears watching as there are very few data series that follow small business activity. Full Analysis
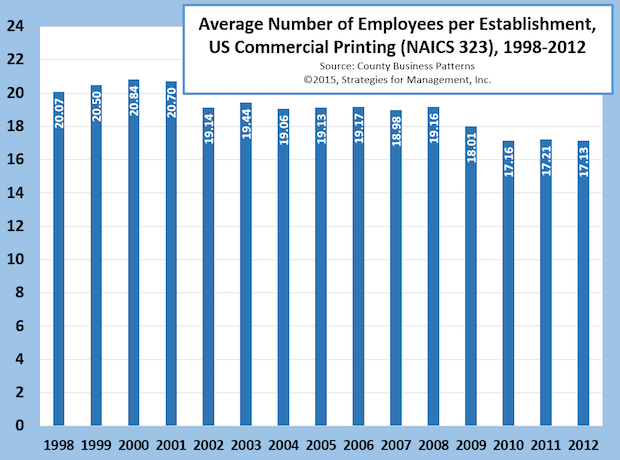
Number of Employees per US Commercial Printing Establishment
Published: April 9, 2015
The average number of employees in commercial printing establishments has declined over the years for many reasons. Among large printers, volumes of magazines, catalogs, inserts, and other long run length products produced on web offset and gravure presses have declined, leading to plant closures and consolidations. Desktop publishing shifted work to graphic designers, publishers, and other content creators. That, combined with direct-to-plate and digital printing have nearly eliminated the need for prepress departments. Presses require less staffing than older ones. In smaller printers, copies and digital printers have reduced the need for press operators. Other technologies, such as search engines, e-commerce, advances in administrative software have reduced employment in other functions. Even voice mail, cell phones, and e-mail have gradually reduced the number of staff required to run a printing business. Full Analysis
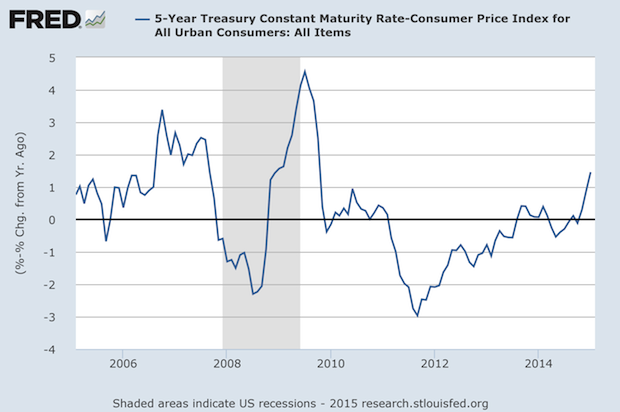
Real Interest Rates are Rising, Thanks to Low Inflation
Published: March 26, 2015
The chart shows one of the rates for Treasury securities called the “constant maturity rate,” used to set rates for instruments like mortgages. The line in the chart is that monthly rate less the year-to-year change in the Consumer Price Index for that month. The Fed has worked hard to keep their interest rates below inflation to stimulate the economy, as well as make housing prices rise so that fewer mortgages were “under water.” It hasn't worked that well, but that's a different topic for a different day. But with all of the worries about the Fed raising rates, the combination of their inertia and changes in the inflation rate may be producing what they've wanted: a Seinfeldian case of “nothing” becoming something. At the end of 2011 the real rate in the chart was -3%, and the last observation in the chart is about +1.5%, a 450 basis point move. For about three years, the CPI has been below the Fed's target of 2%, and in December and January it was negative. February CPI was just reported as an annualized 2.4%, so this rate rise may disappear soon Full Analysis
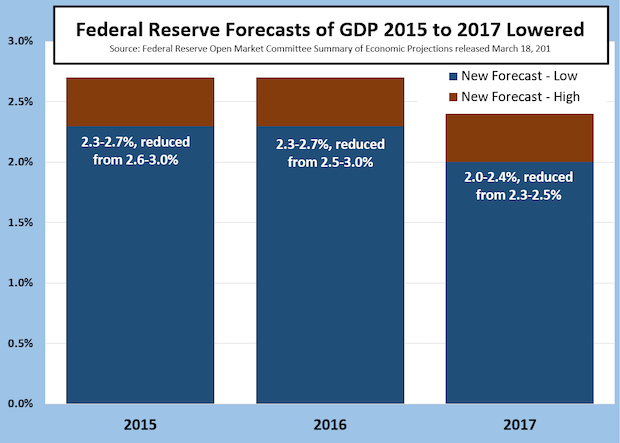
While The World Listens for a Rate Hike News, the Fed Lowers Their GDP Forecasts
Published: March 19, 2015
On Wednesday, March 18, the Feb removed the word “patient” from the announcement of a potential rate hike, but as the Washington Post explained “Well, the Fed really said that it's going to be more patient than it was before, even if it's not officially so. In other words, it could hike rates at any time starting in June, but it's less likely to do so. And even when lift off does happen, it'll probably happen slower than people thought it would.” There you have it: Janet Yellen does a great Alan Greenspan impression. No one knows what he meant but everyone knows what he said. Dr. Yellen also explained that while the Fed is no longer in the act of quantitative easing, they are replacing all of their holdings as they mature. What got less coverage is that the Fed lowered their forecasts of GDP. For 2015 and 2016 they lowered their prior forecasts by three-tenths of a percentage point. Each tenth is about $150 billion. So their forecast was reduced by $450 billion, or the equivalent of six commercial printing industries. Such data analogies can make one's head spin. Full Analysis
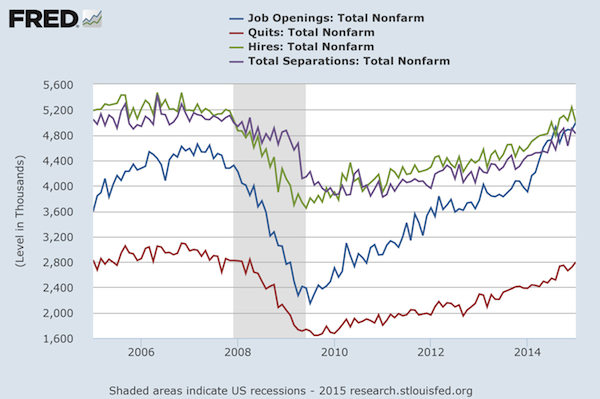
The Labor Market is Very Dynamic
Published: March 12, 2015
Don't let four jagged lines on a chart confuse you, because there's good news hidden inside. The labor market is very dynamic, more dynamic than commonly understood. About 2% of the workforce quits jobs every month, and between 1.5%-2% separate from their positions in other ways because their projects are completed, fired for cause, or downsizings. About 3% of the workforce is hired in different positions every month. What's made the improvement in total employment this past year is the increase in job openings (the blue line in the chart). Note that it has a higher upward slope than the other lines. The number of job openings is now around 5 million per month, more than double that when the recovery started in mid-2009. The bottom line, in red, is “quits.” Most workers do not quit their jobs unless they have something better lined up. That line has a general upward slope, and it is common for this to increase as economies improve and workers feel more comfortable changing positions. Though not population-adjusted, the lines are definitely moving in positive directions, with job openings as the most encouraging of them. What's this mean to printers? Never consider your business contacts in companies as “safe.” As economies improve, job changing increases. Be sure to have multiple engaged contacts in your most important clients. Also, be sure your key employees are kept “gruntled” because disgruntled key employees can be valuable elsewhere. Full Analysis
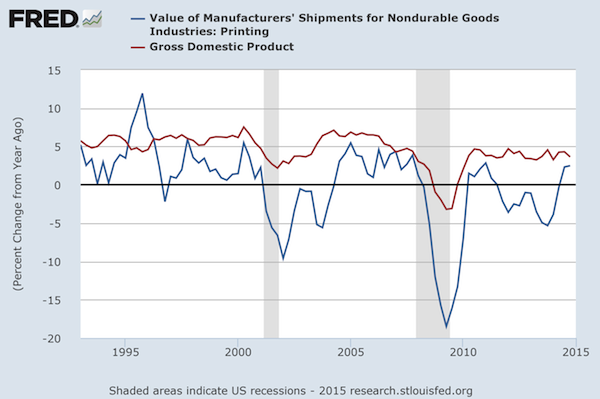
Current Dollar GDP and NAICS 323 US Commercial Printing Shipments
Published: March 5, 2015
There is a general (and natural) assumption that commercial printing and the economy as measured by GDP move together. The chart below shows the year-to-year percentage change of the two data series, GDP in red and printing in blue. The chart tracks current dollars and are not adjusted for inflation. Except for a brief period from the second quarter of 1995 through the first quarter of 1996, shipments have lagged GDP growth. What was special about that period? The Internet bubble was beginning, and in September 1995, Netscape had its initial public offering. For those four quarters, commercial printing was an average of 4.5 percentage points better than GDP growth. Prior to that, commercial printing had lagged GDP during a period of slow economic growth. Since Q2-1996, the difference between nominal, unadjusted GDP and commercial printing has been 5 percentage points. The last two quarters of 2014 commercial printing had positive growth compared to the prior year, but still lagged GDP by -1.6 percentage points. Full Analysis
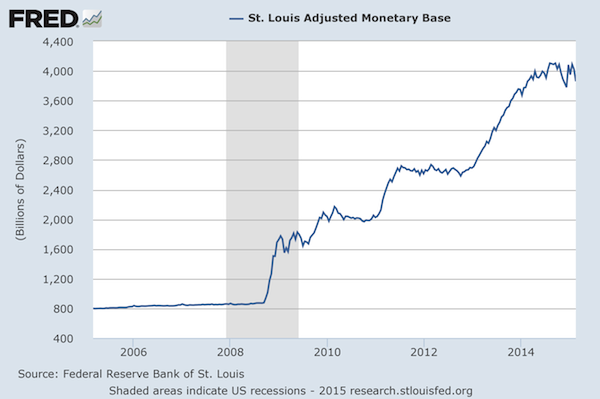
St. Louis Adjusted Monetary Base (The Fed's Balance Sheet)
Published: February 26, 2015
The Fed stopped Quantitative Easing a while ago, and the value of its balance sheet fluctuates around the $4 trillion level. As their holdings mature, their aggressive position in the bond market will slowly unwind. Or will it? The Fed is likely to decide to re-invest proceeds in more bonds and obligations, replacing the matured debt with new ones, but not adding to their overall position unless there is a crisis again. Until their first moves where they doubled their balance sheet quickly, from $800 billion to $1.6 trillion, this measure of the money supply moved steadily at about a 6% annual rate, sometimes a little more, sometimes a little less, about half equal to economic growth and the other half to inflation. Whether or not the Fed will reduce its balance sheet or not is still a question in my mind. They could just hold steady, and let inflation and growth catch up to them, which will take quite some time, but not scare the markets. But something always happens that's not according to plan, and the Fed will be interesting to watch as they move from this unchartered territory to another. Full Analysis
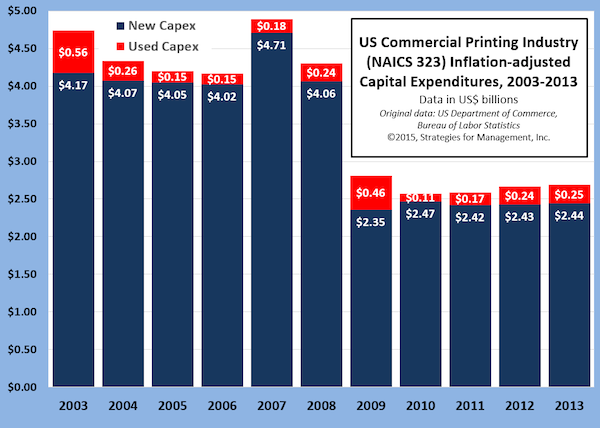
Printing Industry Capital Investment, 2003 to 2013
Published: February 20, 2015
The US Department of Commerce issued their latest report about capital investment spending in 2013, and we've written about it in a recent blogpost. As part of our analysis, we applied the rate of investment to industry shipments and arrived at the chart below. It shows two rather distinct periods, 2003 to 2007, where capital investment was not as good as the late 1990s, but recovered and stabilized after the first negative wave of digital media. Some of this was replacement of late 1990s equipment that had come off lease. Then there's the 2008 credit crisis and recovery. Capital investment declined in volume as industry shipments fell from the introduction of social media, new devices, and cheaper and faster communications. But the rate of capital investment is slowly rising, even though shipments are shrinking, and the number of plants is contracting. The survivors tend to be healthier establishments, who survived the downturns, and are likely making better investment decisions. Full Analysis
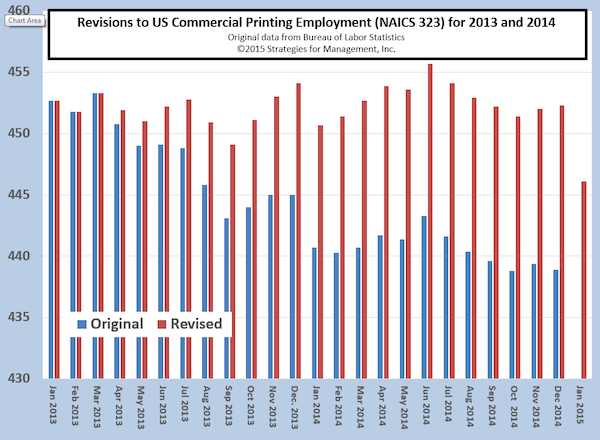
Printing Employment Data Revised Up in 2014
Published: February 12, 2015
Every February, the Bureau of Labor Statistics (BLS) updates employment data for the prior year and beyond. This year, the revisions to printing industry employment went back to April 2013. When the BLS calculates employment, especially for industries, it uses estimation methods because actual data are not readily available. That actual data are derived from the Social Security tax filings of employers. In this case, the BLS was underreporting employment, especially in mid-2014. Employment data are used as an input into Commerce Department data for the estimation of industry shipments. Those new employment data, though not released publicly, were probably used in recent months shipment calculations when 2014 shipments began to have favorable comparisons to 2013. It is possible, based on these data, that 2014 industry shipments will be revised up in the annual mid-May shipment revision report. An educated guess would put the change at approximately $1 billion, bringing shipments from +0.2% in current dollars to about +1.5%, or flat with 2013 after adjusting for inflation. Nonetheless, employment in December 2014 was less than December 2013. As can be seen in the chart, January 2015 employment is reported as dropping considerably. January and February tend to be slow months, and March can be one of the best. February employment may rise in anticipation. Full Analysis
Recovery Indicators
Published: February 5, 2015
Recovery indicators in manufacturing continued to retreat in the ISM manufacturing report, in concert with news earlier this week from the Commerce Department that showed five months consecutive decline for factory orders. Non-manufacturing orders rose slightly, but imports continued to pull back. The ISM new orders for manufacturing and non-manufacturing are still above 50, which indicates future growth, but at a slower rate. The NASDAQ index was up in the last month, but is still lower than it was two months ago. Trading has been choppy, which sometimes is indicative of a developing turning point. The one bright spot in the report is a measure of small business, proprietors income, upbeat news in an otherwise tough month. Full Analysis
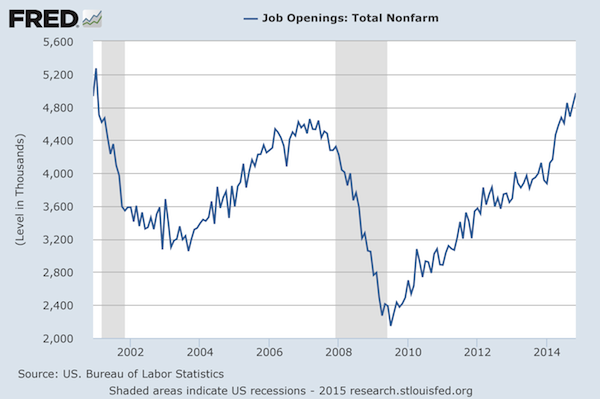
Job Openings Steadily Improving but Have More to Go
Published: January 30, 2015
The following charts show how job openings have been on a steady rise since the beginning of the recovery in mid-2009, and have now passed the recent peak when the recession began at the end of 2007. But that was a long time ago, and population has grown since that time. The 2000s have a long way to go to catch up with population-adjusted job openings since the turn of the century. Full Analysis
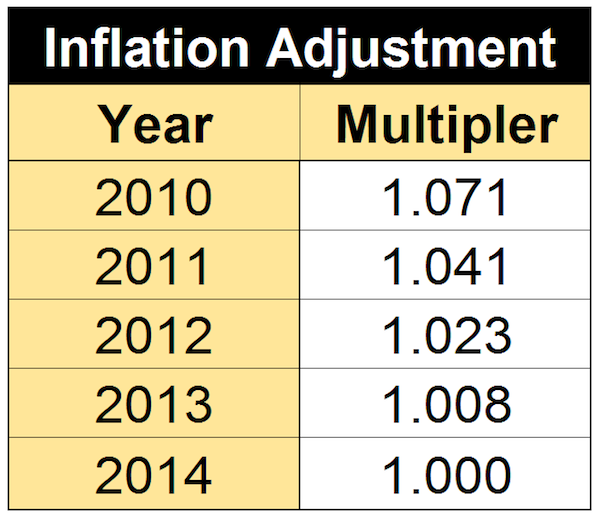
Latest Inflation Multipliers
Published: January 22, 2015
For those who have been following along, the chart below is the latest update for budget planning. It's always a benefit to understand your sales and costs in historical perspective. Without adjusting for inflation, you could be working on assumption of trends and relationships that are untrue. Make it “real.” Full Analysis
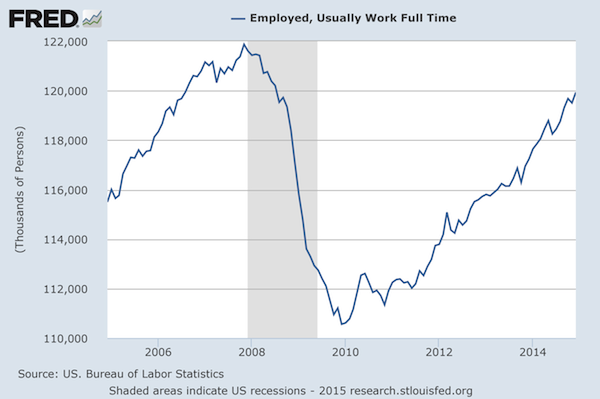
Full Time Employment Still Not Recovered
Published: January 15, 2015
The number of workers with full time jobs has still not exceeded levels at the start of the recession about seven years ago. This is despite continuous population growth and higher GDP levels for 21 of the last 22 quarters. Of last year's +2.2 million increase in employment, about 970,000 were part time positions. Many part time positions are by choice of the employee, an unknown number may be from distortions resulting from the implementation of the Affordable Care Act, and others are from uneven economic conditions and low expectations about future business conditions. There is some employment optimism in recent surveys of the National Federation of Independent Business and both the manufacturing and non-manufacturing surveys of the Institute for Supply Management. Full Analysis
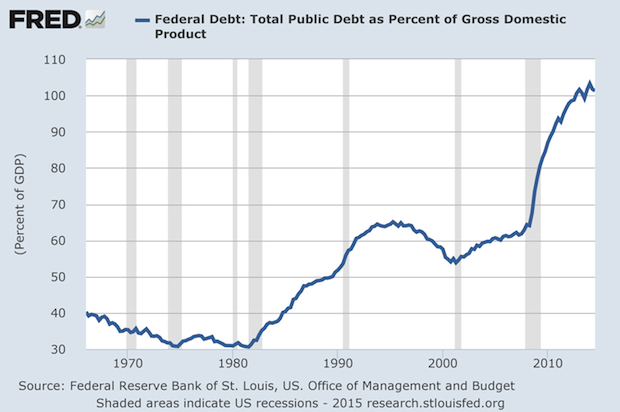
Federal Debt as Percentage of GDP Over 100%
Published: January 8, 2015
Economic press coverage of the Federal budget is usually limited to the annual deficit, the shortfall of tax and fee collections versus spending. While the deficit as a percentage of GDP is down to about -4% from 2009 when it was more than -9%, the deficits do accumulate. Now, the total debt of the US exceeds GDP. This is likely to keep political pressure on the Fed to keep rates down. It also means that a 1 percentage point rise in interest rates would cost $180 billion and can double the annual deficit. But the Fed may not be able to increase interest rates when they want to no how hard they might try. International rates, such as those in Germany, have recently been below 0.5% for the 10 year bond. US rates are comparatively high in the 2% range, and any push upward by the Fed would probably be met by arbitrage actions in the other direction. Full Analysis
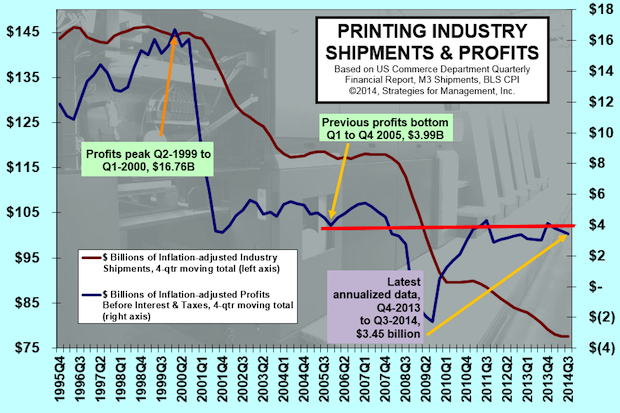
Profits Still Below $4 Billion on Annual Basis
Published: December 18, 2014
Four billion dollars was the approximate bottom of 2005's inflation adjusted annual profits. The four-quarter total annual profits have had a difficult time breaking through that level for more than eight years. Full Analysis
Inflation-adjusted Sales of S&P 500 Firms Still Below Pre-Recession Levels
Published: December 11, 2014
GDP may say that the recession ended in June 2009, but there are still data series that have not yet confirmed that five years later. Total employment is one of them, as is median household income, but so is the inflation-adjusted sales of companies in the S&P 500. Even though the companies in the S&P 500 index have revenues lower than the peak of June 2008, the S&P 500 stock index is getting closer to all-time high levels of Spring 2000 (The Dow Jones average already is, the Russell 2000 has been for a while, but the NASDAQ is still off by about 15%). These sales of 500 of the world's best companies have not kept up with real GDP growth since the recession ended (about 2% per year). Some economists believe that this is an indication that GDP data should be viewed with great suspicion, and that there has yet to be a true recovery. Full Analysis
Revised GDP Pushed Higher, But Did Not Change Longer Range Growth Rate
Published: December 4, 2014
Third quarter GDP was revised from +3.5% to +3.9%, but the change was mainly in net inventories, and did little to affect the assessment of underlying and longer range growth compared to the prior year of about +2.43%. Inventories have been bouncing around a bit over recent quarters and are running a little higher than they should be, indicating that some minor correction is forthcoming, especially if non-US economies are slowing down. Full Analysis
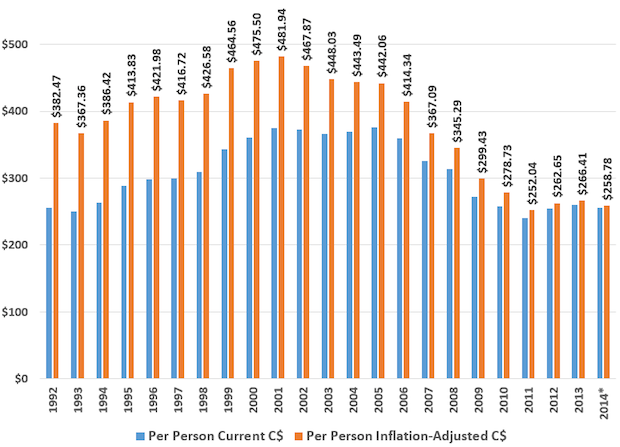
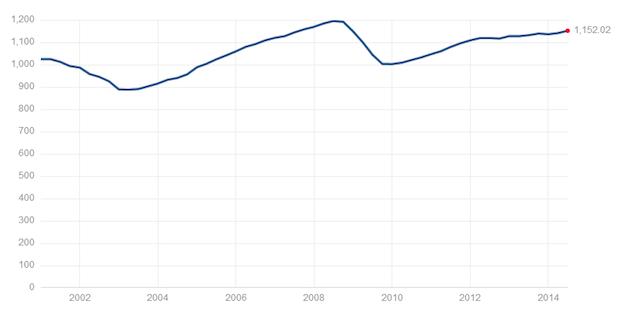
Canada Per Capita Commercial Printing 1992-2014
Published: November 14, 2014
Using printing shipments and population data from Statistics Canada, we have prepared this chart that shows per capita shipments of commercial printing in Canada current dollars and Canada inflation-adjusted dollars. Full Analysis


![]()
- Innovations in Inkjet for Textile Production – live webinar
- Buying Inkjet Part 1: Does This Printer Make Me Look Good?
- LabelExpo 2023: Launches and Trends – Part 2
- Driving profitability with cut-sheet inkjet
- Zero Trust Environments for Inkjet Printing
- Kevin Roman on the evolution of professional services needs
- LabelExpo 2023: Launches and Trends – Part 1
- Inkjet Gets into “Hard Core” Applications
© 2023 WhatTheyThink. All Rights Reserved.